Advantages of Segmented Flow Analysis Over Flow Injection Analysis
(1).jpg?resolution=1105x622&quality=95)
There are two kinds of continuous flow analysis:
| Segmented Flow Analysis (SFA): The reaction stream is segmented with bubbles of air or nitrogen, creating “Bolus Flow” and reducing inter-sample dispersion. |  |
| Flow Injection Analysis (FIA): There are no air bubbles in the reaction stream, creating “Laminar Flow”. The dispersion in the system is used to mix the samples and reagents. |  |
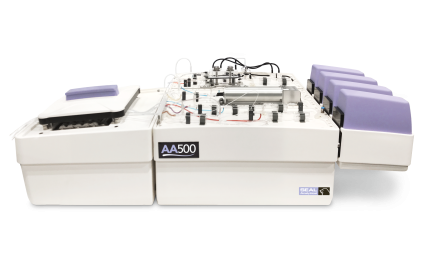
SEAL Analytical continuous flow analyzers use SFA technology because the addition of segmentation brings important advantages to routine analysis, including:
- Maximum sensitivity
- Reactions analyzed at completion
- No interference from micro bubbles
- Easy visual check of system operation and fluidics
- Low detection limits
- Stable and robust analytical methods
- Automation of complex procedures and sample pre-treatment
- Removal of interferences from dirty samples
1. Maximum Sensitivity
Two factors contribute to sensitivity:
- Complete reaction between reagents and sample
- Measuring the final reaction mixture at maximum concentration
Achieving a complete reaction:
If a time delay is necessary, the reaction stream can be delayed or heated. Because SFA can automate longer, hotter reactions, it allows slow reactions to proceed to completion as shown in the diagram.
| SFA | FIA | |
| Max. possible reaction time | 20 minutes | 1 minute |
| Max. possible reaction temperature | 95 °C | 60 °C |
Advantages of a complete reaction include:
- Sensitivity is brought to its maximum potential
- Small variations in reaction conditions such as changes in flow rate or temperature do not affect method sensitivity
- When the method sensitivity remains constant, results stay within specification for longer and recalibration is necessary less often

2. Reaction Analyzed at Completion
The sample concentration in the detector reaches a constant, maximum value (Steady State)
The output from a SFA system is a peak with a flat plateau. The plateau represents a constant, steady state value in the flowcell, at maximum concentration. The sample result is calculated from the peak height, which is averaged from readings on the plateau. In contrast, the sample peak from a FIA system only reaches maximum concentration for an instant.
The Steady State peaks of segmented flow analysis maximize sensitivity in two ways:
- The sample concentration in the flowcell reaches its maximum value, undiluted by wash or carrier solution.
- Maximum concentration is maintained for long enough to obtain an accurate reading.
 | Detector signal from a sample measured for a long time. Between t1 and t2 the concentration in the flowcell is constant. |
 | Sample peak from a normal SFA analysis. The sampling time is long enough to allow several seconds of steady state at maximum concentration. |
 | Sample peak from normal FIA (flow injection) analysis. |
3. No Interference from Micro Bubbles
Degassing from samples or reagents can introduce unwanted air bubbles into the reaction stream.
Whereas SFA systems are designed to work with bubbles in the reaction stream, air bubbles interfere with FIA in two ways:
- The pressure inside a FIA system is high, because 2-4 ml/min are pumped through tubing 0.8-1 mm internal diameter. Compression of the air bubble disrupts the regular flow which is necessary for reproducible results.
- As shown in the figures below, an air spike is easily separated from the height measurement of a SFA peak’s flat plateau, but cannot be easily removed from a FIA peak, whether the area or height is measured.
 | SFA peak with interference from an air bubble in a reagent. The spike is eliminated from the average reading for the peak plateau and does not affect the result. |
 | The same air spike super-imposed on a FIA peak affects measurement of height or area. |
4. Easy Visual Check of System Operation and Fluidics
The individual segments in SFA systems offer two advantages:
- The segments of liquid and air with a regular bubble pattern make it easy to see that the flow is correct and to identify the source of a problem such as a reagent which has run out or a tube which is blocked.
- The result for each segment is stored by the computer, so a complete run can be replayed for fault finding. The concentration of each segment can be displayed, to provide a validation check on the final result.
5. Low Detection Limits
SFA systems maintain maximum concentration of the reaction in the flowcell for a longer period.
Even at very low concentrations, maximum concentration in the flowcell is maintained for several seconds in an SFA system, so the signal can be distinguished from background noise. In contrast, the maximum concentration of a FIA peak exists for only an instant. Combined with the maximum sensitivity available from complete reaction, this results in a lower method detection limit for the SFA system.
 |  |
| SFA peak at low concentration. The complete plateau lies above the baseline, and an accurate average can be calculated. | FIA peak at low concentration. Only the small central portion lies above the baseline. |
6. Stable and Robust Analytical Methods
A “robust” method delivers stable, constant results over a long time and is not affected by small changes or disturbances in the analysis conditions. Several factors contribute to the stability of SFA methods
 | 1. Even slow reactions go to completion: changes in reaction time or temperature do not affect the method sensitivity or the sample result. The diagram to the left shows the effect on method sensitivity of a 2% increase in reaction time. Such a small change can easily occur as the pump warms up during the analysis and flow rates drop. The SFA method sensitivity is not affected: the FIA method sensitivity changes by 4.4%. |
| 2. Each peak reading is the average of several at maximum concentration: interferences are easy to identify and separate. The sample peak from an SFA analysis has a steady-state plateau at maximum concentration. As shown here, this plateau consists of multiple individual data points. The final result is the average of the readings from several separate liquid segments. |  |
 | 3. Changes in sample matrix do not affect the result. This graph shows the effect on the analysis result from samples containing impurities which change the reaction rate. |
7. Automation of Complex Procedures and Sample Pre-Treatment
SFA can automate complex and long analytical procedures and pretreatment steps such as:
|  |

8. Interference Removal for Dirty Samples
Dialyzers in methods for wastewater, soil, and other matrices with high TSS allow only small ions or molecules to pass through the membrane.
The sample enters the top channel of a dialyzer block, with a cellulose membrane separating the top channel (sample) and bottom channel (clean carrier solution). The analyte of interest diffuses through the cellulose membrane into the clean carrier solution, while large colored compounds, protein, fat and suspended solids stay in the top channel and are pumped out to waste. The clean carrier solution with the dissolved analyte continues on through the manifold to undergo the colorimetric reaction.

Interested in exploring segmented flow analyzers and other nutrient analyzers?
Discover segmented flow analyzers and discrete analyzers ready to automate your nutrient analysis, sample prep, calibration standard prep, and more! Explore alternatives to Flow Injection Analysis here.
Connect with our technical team to talk through your specific needs and find the best approach for your laboratory.


.jpg?resolution=428x267&quality=95)
